The Sacramento Real Estate Market Is Insane
Check out the visuals below for local market statistics.
RAPID PRICE GROWTH
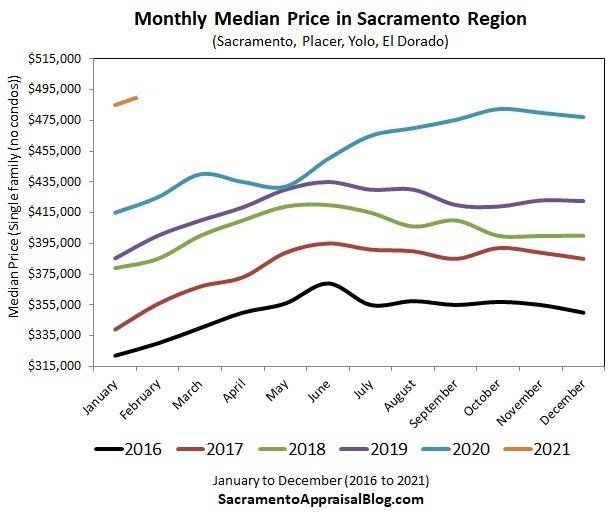
The chart above helps show the median price rhythm from January 2016 to January 2021. Typically we'll see the prices go up and then come back down toward the fall and winter months. When we take a look at 2020 (the teal line), there is a huge price dip in April toward the beginning of the pandemic and then prices continued to rise in the fall completely defying the trend from years prior. At the start of 2020 the median price was $415,000 and now at the start of 2021 we have skyrocketed to $485,000. Buyers have to be ultra competitive and we're seeing crazy offers as much as $50k over asking if not higher! Incredible!
NOT ENOUGH HOMES ON THE MARKET
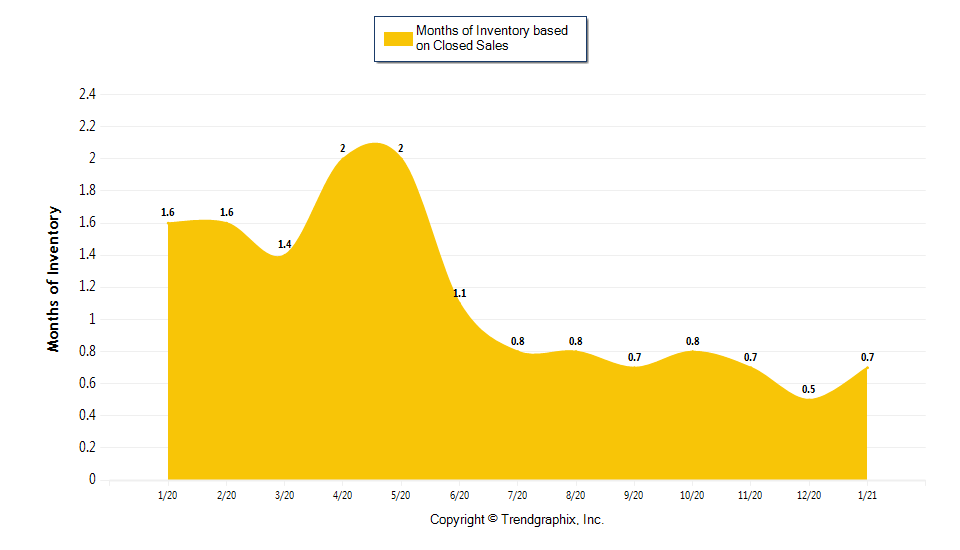
Based on the image above, we are looking at less than a months worth of inventory. We are up 41% compared to last month and down 55% compared to last year. This ties directly into the rapid rise in price as depicted in the previous chart. A overwhelming amount of buyers and nowhere near enough homes for sale.
DAYS ON MARKET ARE LOW
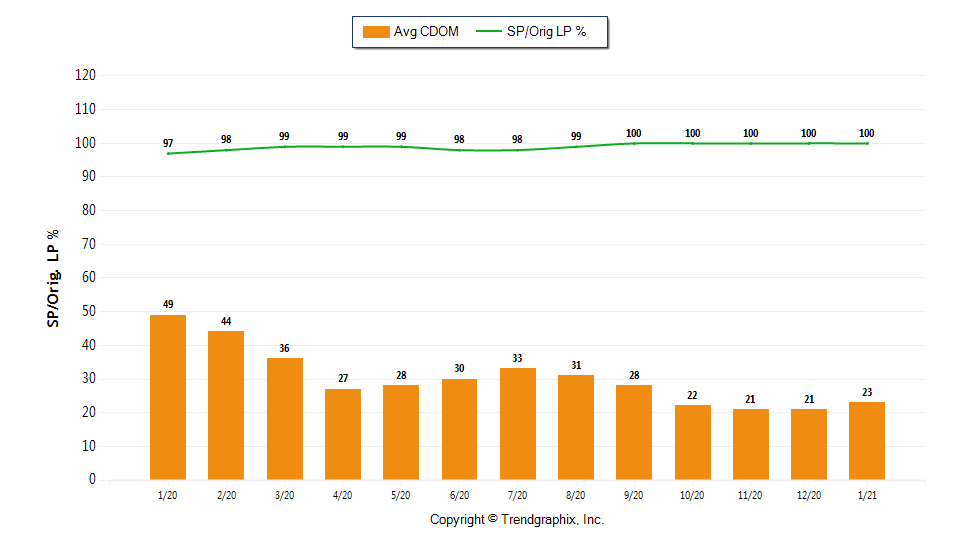
The average days on market has remained steady since last October. We are currently at 23 days on market which is slightly up from the previous month but down 53% compared to this time last year. Many of our own listings are pending in less than a week! In most cases we go LIVE on a Thursday, we have showings over the weekend, review offers on Monday, and are in contract that same day! It's a "you blink and it's gone" kind of feeling.
Though the market is competitive due to low inventory and prices are on the rise, interest rates are still the lowest they've been in years. It is both a good time to sell as well as buy. Though we do not have a crystal ball, and there is still uncertainty around where our economy is headed with slow progress around the pandemic, the real estate market continues to thrive.



CONTACT
LICENSE NUMBERS
DRE# 01975523
DRE# 01880424
BROKER LICENSE
DRE# 01485473
All Rights Reserved | Bobby & Afton Real Estate Group | Privacy Policy

Real Estate Web Design by Bullsai
